Beyond PEB Walking: Alternative Ways to Find DLL Base Addresses and Resolve Functions at Runtime

Beyond PEB Walking: Alternative Ways to Find DLL Base Addresses and Resolve Functions at Runtime
If you’ve ever looked into how shellcode or position-independent code resolves Windows API functions at runtime, you’ve probably seen the classic approach: walk the PEB→Ldr→InMemoryOrderModuleList linked list to find loaded DLLs, then parse their export tables. It works. It’s documented everywhere. And that’s exactly the problem - every EDR, every sandbox, every analyst knows to look for it.
This post explores five alternative techniques for finding ntdll.dll and kernel32.dll base addresses without touching the PEB loader lists. Once we have kernel32’s base, we walk its PE Export Table and resolve LoadLibraryW and GetProcAddress using DJB2 hash matching - no function name strings anywhere in the binary.
Why these two? Because once you have LoadLibraryW and GetProcAddress, you can load any DLL and resolve any function at runtime. That’s the entire Windows API at your fingertips - from two function pointers that you found without ever touching PEB→Ldr.
We’ll go through each technique with the actual C code, explain what every line does, and show how you can verify each step in WinDbg.
The POC Codes : - https://github.com/jaytiwari05/Six-Path-Of-Pain
Table of Contents
- The Foundation: What We’re Building On
- Technique 1: Stack Scan + MZ Backward Walk
- Technique 2: Thread Entry at Stack Bottom
- Technique 3: Export Table Bootstrap
- Technique 4: IAT Parsing
- Technique 5: VEH + Deliberate Exception
- The Payoff: DJB2 Hash-Based Function Resolution
- The Endgame: LoadLibraryW + GetProcAddress = Everything
- Key Takeaways
The Foundation
Before we dive in, let’s establish the three pieces of Windows internals knowledge that every technique relies on.
1. The Thread Environment Block (TEB)
Every thread in a Windows process has a TEB. On x64, the gs segment register at offset 0x30 points to it. In C code, NtCurrentTeb() gives you the pointer portably.
The TEB fields we care about:
1
2
3
4
5
Offset   Field              What It Gives Us
──────   ─────              ────────────────────────────────────
+0x008   StackBase          Top of the stack (highest address)
+0x010   StackLimit         Bottom of the stack (lowest address)
+0x060   PEB pointer        Points to the Process Environment Block
In WinDbg, you can dump these right now:
1
2
3
0:000> dq @$teb+0x08 L1       ; StackBase
0:000> dq @$teb+0x10 L1       ; StackLimit
0:000> dq @$teb+0x60 L1       ; PEB
In C:
1
2
3
ULONG_PTR teb       = (ULONG_PTR)NtCurrentTeb();
ULONG_PTR stackBase = *(ULONG_PTR *)(teb + 0x08);
ULONG_PTR stackLimit = *(ULONG_PTR *)(teb + 0x10);
No API calls, no PEB→Ldr, no linked lists. Just reading from a segment register offset.
2. The 64KB Alignment Rule
Windows loads every PE image at a 64KB-aligned address. This is the system allocation granularity. It means every DLL’s base address ends in 0x0000.
Why does this matter? Because if you have any code pointer inside a DLL, you can find the DLL’s base by:
- Masking to the nearest 64KB boundary:
addr & ~0xFFFF - Checking if the MZ signature (
0x5A4D) is there - If not, subtracting
0x10000and checking again - Repeating until you find it
A DLL that’s 1MB in size means at most ~16 backward steps. In practice, you usually hit it in 1-5 steps.
3. The MZ + PE Signature Validation
Finding 0x5A4D (“MZ”) at a 64KB boundary isn’t enough - you could hit coincidental bytes. To confirm it’s a real PE:
- Read the DWORD at offset
+0x3C- this ise_lfanew, the offset to the PE header - Check that
e_lfanewis sane (positive, less than0x1000) - Read the DWORD at
base + e_lfanew- it should be0x00004550(“PE\0\0”)
If both checks pass, you’re standing on a valid PE image.
Here’s what this looks like in code - this FindModuleBase function appears in every technique:
1
2
3
4
5
6
7
8
9
10
11
12
13
14
15
16
17
static ULONG_PTR FindModuleBase(ULONG_PTR addr)
{
    addr &= ~((ULONG_PTR)0xFFFF);          // align to 64KB
    for (int i = 0; i < 2048; i++) {
        if (Readable(addr, 0x1000)) {        // don't touch unmapped memory
            if (*(USHORT *)addr == IMAGE_DOS_SIGNATURE) {      // "MZ"?
                LONG lfanew = *(LONG *)(addr + 0x3C);
                if (lfanew > 0 && lfanew < 0x1000 &&
                    *(DWORD *)(addr + lfanew) == IMAGE_NT_SIGNATURE)  // "PE\0\0"?
                    return addr;             // found it
            }
        }
        if (addr < 0x10000) break;
        addr -= 0x10000;                     // step back one 64KB block
    }
    return 0;
}
And the Readable check uses VirtualQuery to avoid crashing on unmapped pages:
1
2
3
4
5
6
7
8
static int Readable(ULONG_PTR addr, SIZE_T sz)
{
    MEMORY_BASIC_INFORMATION mbi;
    if (!VirtualQuery((LPCVOID)addr, &mbi, sizeof(mbi))) return 0;
    if (mbi.State != MEM_COMMIT) return 0;
    if (mbi.Protect & (PAGE_NOACCESS | PAGE_GUARD)) return 0;
    return ((ULONG_PTR)mbi.BaseAddress + mbi.RegionSize) >= (addr + sz);
}
Identifying Which Module You Found
Once you have a PE base, how do you know if it’s ntdll or kernel32? The PE’s Export Directory contains the DLL’s own name:
1
2
3
4
5
6
7
8
9
static const char *GetModuleName(ULONG_PTR base)
{
    IMAGE_DOS_HEADER *dos = (IMAGE_DOS_HEADER *)base;
    IMAGE_NT_HEADERS *nt  = (IMAGE_NT_HEADERS *)(base + dos->e_lfanew);
    DWORD rva = nt->OptionalHeader.DataDirectory[IMAGE_DIRECTORY_ENTRY_EXPORT].VirtualAddress;
    if (!rva) return NULL;
    IMAGE_EXPORT_DIRECTORY *exp = (IMAGE_EXPORT_DIRECTORY *)(base + rva);
    return exp->Name ? (const char *)(base + exp->Name) : NULL;
}
Call it and compare: "ntdll.dll" or "KERNEL32.DLL". No PEB, no Ldr, just PE parsing.
In WinDbg, you’d do the same thing manually:
1
2
3
4
5
; Given a PE base at <BASE>:
0:000> dd <BASE>+3c L1                          ; read e_lfanew
0:000> dd <BASE>+<e_lfanew>+88 L2               ; Export Directory RVA (DataDirectory[0])
0:000> dd <BASE>+<ExportDir_RVA>+0c L1          ; Name RVA inside Export Directory
0:000> da <BASE>+<Name_RVA>                      ; print the DLL name string
Now let’s look at five different ways to get that initial code pointer.
Technique 1: Stack Scan + MZ Backward Walk
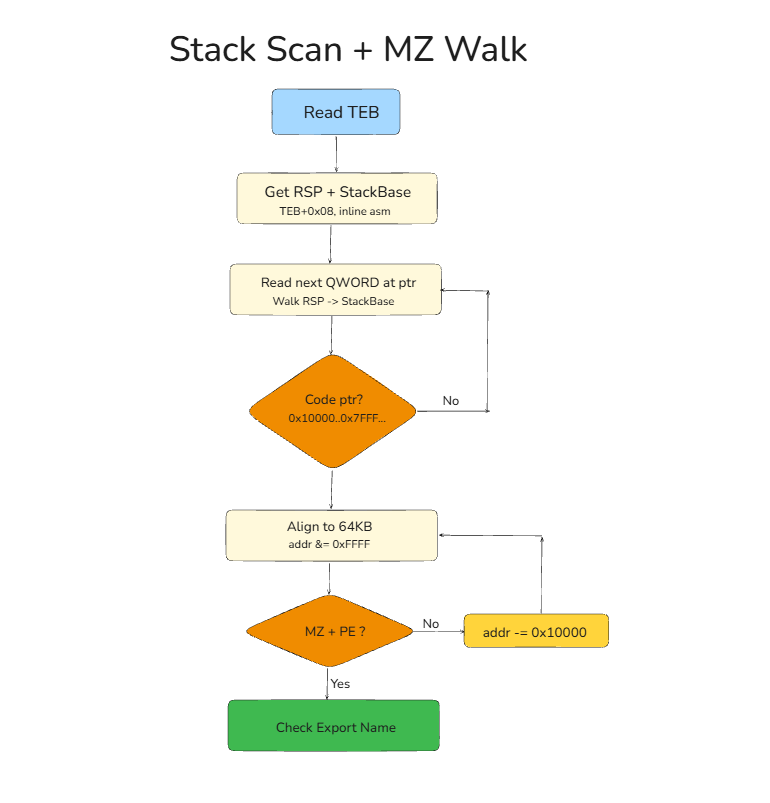
Core idea: Your thread’s call stack is full of return addresses. Each return address points into the DLL that called the next function. Read the stack as raw memory, take each pointer-sized value, and MZ-walk backward from it.
Why it works
When function A in kernel32.dll calls function B in your exe, the CPU pushes the return address (inside kernel32) onto the stack. That address is still there when your code runs. Every thread has a chain like:
1
ntdll!RtlUserThreadStart → kernel32!BaseThreadInitThunk → your_main
So the stack always contains pointers into both ntdll and kernel32.
The code
1
2
3
4
5
6
7
8
9
10
11
12
13
14
15
16
17
18
19
20
21
22
23
24
25
26
int main(void)
{
    ULONG_PTR teb       = (ULONG_PTR)NtCurrentTeb();
    ULONG_PTR stackBase = *(ULONG_PTR *)(teb + 0x08);  // TEB.StackBase
    ULONG_PTR rsp       = GET_RSP();                     // current stack pointer

    ULONG_PTR ntdll = 0, k32 = 0;

    // Walk from current RSP up toward StackBase
    for (ULONG_PTR p = rsp; p < stackBase; p += sizeof(ULONG_PTR)) {
        ULONG_PTR val = *(ULONG_PTR *)p;

        // Filter: user-mode code range only
        if (val < 0x10000 || val > 0x7FFFFFFFFFFF) continue;

        // Try to MZ-walk backward from this value
        ULONG_PTR base = FindModuleBase(val);
        if (!base) continue;

        // Identify by export name
        const char *name = GetModuleName(base);
        if (name && _stricmp(name, "ntdll.dll") == 0)    ntdll = base;
        if (name && _stricmp(name, "KERNEL32.DLL") == 0)  k32  = base;
    }
    // ntdll and k32 now hold the base addresses
}
What’s happening step by step
- Get stack boundaries from TEB - no API calls
- Read RSP via inline assembly (
mov %%rsp, %0on GCC) - Iterate every 8-byte value on the stack from RSP to StackBase
- Filter out non-pointers - anything below
0x10000is definitely not a code address, and anything above0x7FFFFFFFFFFFis kernel space - MZ-walk each candidate backward to find its PE base
- Check the export name to identify which DLL it belongs to
Verify in WinDbg
1
0:000> dps @rsp L100
You’ll see values like 00007ffd'd92e7818 ntdll!LdrInitializeThunk+0xe. That 00007ffd'd92e7818 is exactly the kind of value our code picks up. WinDbg shows the symbol because it has debug info - our code doesn’t need it.
Technique 2: Thread Entry at Stack Bottom
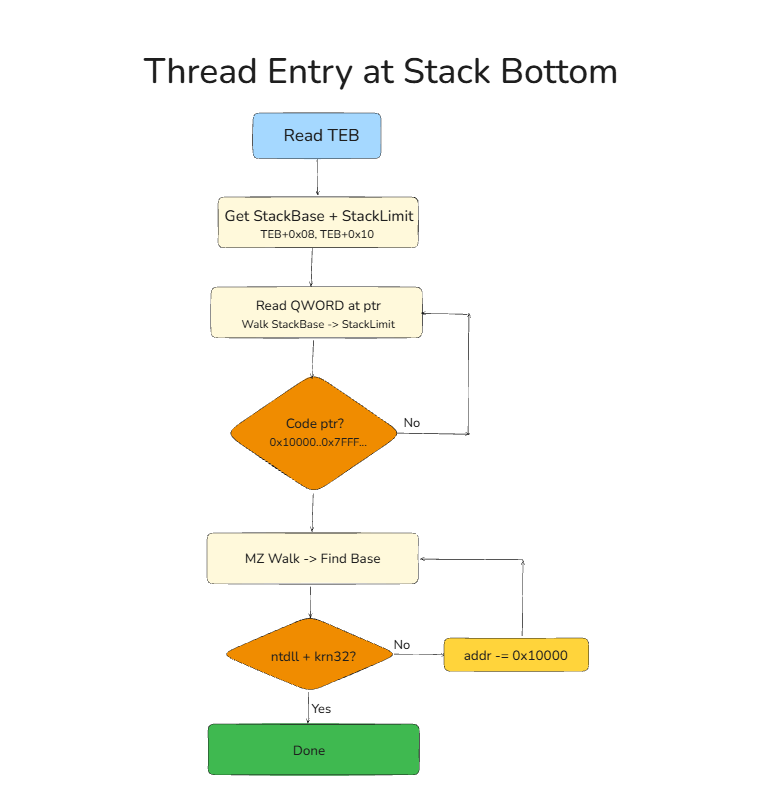
Core idea: Don’t scan the whole stack. Go straight to the bottom. Every user-mode thread’s deepest two frames are always ntdll!RtlUserThreadStart and kernel32!BaseThreadInitThunk. They’re sitting right near StackBase.
Why it works
The Windows loader sets up every thread’s call chain identically:
1
2
3
ntdll!RtlUserThreadStart      ← deepest frame (address is inside ntdll)
  kernel32!BaseThreadInitThunk ← second deepest (address is inside kernel32)
    your entry point
This is baked into the Windows thread creation mechanism. By scanning from StackBase downward, you hit ntdll and kernel32 first - in 1-2 hits instead of scanning potentially hundreds of stack slots.
The code
1
2
3
4
5
6
7
8
9
10
11
12
13
14
15
// Scan from bottom of stack upward (StackBase down toward StackLimit)
for (ULONG_PTR p = stackBase - sizeof(ULONG_PTR); p >= stackLimit; p -= sizeof(ULONG_PTR)) {
    ULONG_PTR val = *(ULONG_PTR *)p;
    if (val < 0x10000 || val > 0x7FFFFFFFFFFF) continue;

    ULONG_PTR base = FindModuleBase(val);
    if (!base) continue;

    const char *name = GetModuleName(base);
    if (!name) continue;

    if (!ntdll && _stricmp(name, "ntdll.dll") == 0)    ntdll = base;
    if (!k32   && _stricmp(name, "KERNEL32.DLL") == 0)  k32   = base;
    if (ntdll && k32) break;   // got both, done
}
The difference from Technique 1: we start from StackBase and go down, so the very first code pointers we encounter are the thread-entry frames.
Verify in WinDbg
1
2
3
4
5
6
0:000> k
 # RetAddr               Call Site
00 ...                    your_exe!main
01 ...                    ucrtbase!...
02 00007ffd`d84adda7      KERNEL32!BaseThreadInitThunk+0x17
03 00007ffd`d933ee4c      ntdll!RtlUserThreadStart+0x2c
Frames 02 and 03 are always there. Their return addresses are what we’re picking up.
Technique 3: Export Table Bootstrap
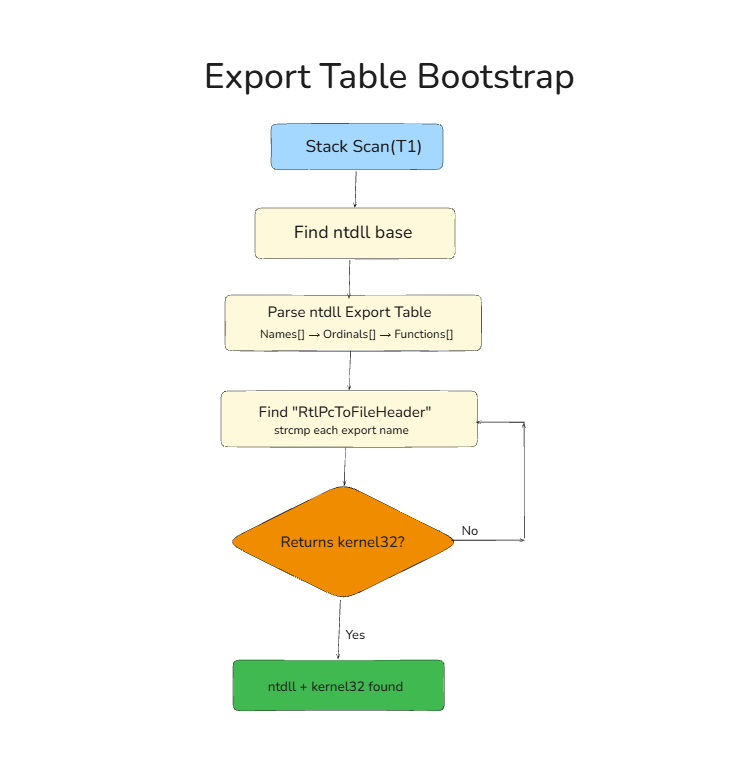
Core idea: Find ntdll via stack scanning, then manually parse its export table to locate RtlPcToFileHeader - an ntdll function that maps any code pointer to its module base. Use that to find kernel32.
This is a “pull yourself up by your bootstraps” approach: find one DLL by brute force, hand-roll your own PE export parser from its raw export table, and use the resolved function to find everything else.
Important: “ManualGetProcAddress” is NOT kernel32’s GetProcAddress
This needs to be crystal clear. The function we call ManualGetProcAddress in the code is our own hand-written PE export table parser. It has nothing to do with kernel32!GetProcAddress. We don’t have kernel32 yet - that’s what we’re trying to find!
Here’s what’s actually happening:
- We find ntdll’s base address via stack scanning (same as Technique 1)
- ntdll is a PE file mapped in memory. Its PE header contains an Export Directory with three parallel arrays listing every function it exports
- We manually walk those arrays ourselves - reading raw memory, comparing strings, following RVA offsets
- We find
RtlPcToFileHeaderby iterating ntdll’s export names until we hit a match - We call
RtlPcToFileHeaderto find kernel32
At no point do we call kernel32!GetProcAddress. We’re doing the exact same work that GetProcAddress does internally - parsing PE export tables - but we’re doing it ourselves, by hand, from raw memory. The name ManualGetProcAddress just describes what the function does, not where it comes from.
The hand-rolled PE export parser
The PE Export Directory has three parallel arrays:
1
2
3
AddressOfNames       → array of RVAs to function name strings
AddressOfNameOrdinals → array of WORDs (indices into AddressOfFunctions)
AddressOfFunctions   → array of RVAs to the actual function code
To find a function by name:
- Walk
AddressOfNames, comparing each string - When you find a match at index
i, readAddressOfNameOrdinals[i]→ ordinal - Read
AddressOfFunctions[ordinal]→ function RVA - Add the DLL base → you have the function pointer
1
2
3
4
5
6
7
8
9
10
11
12
13
14
15
16
17
18
static ULONG_PTR ManualGetProcAddress(ULONG_PTR base, const char *funcName)
{
    IMAGE_DOS_HEADER *dos = (IMAGE_DOS_HEADER *)base;
    IMAGE_NT_HEADERS *nt  = (IMAGE_NT_HEADERS *)(base + dos->e_lfanew);
    IMAGE_DATA_DIRECTORY *dir = &nt->OptionalHeader.DataDirectory[IMAGE_DIRECTORY_ENTRY_EXPORT];
    if (!dir->VirtualAddress) return 0;

    IMAGE_EXPORT_DIRECTORY *exp = (IMAGE_EXPORT_DIRECTORY *)(base + dir->VirtualAddress);
    DWORD *names     = (DWORD *)(base + exp->AddressOfNames);
    WORD  *ordinals  = (WORD  *)(base + exp->AddressOfNameOrdinals);
    DWORD *functions = (DWORD *)(base + exp->AddressOfFunctions);

    for (DWORD i = 0; i < exp->NumberOfNames; i++) {
        if (strcmp((const char *)(base + names[i]), funcName) == 0)
            return base + functions[ordinals[i]];
    }
    return 0;
}
This is pure PE parsing. We’re reading the mapped ntdll image’s bytes directly - base + names[i] walks to the function name string in ntdll’s memory, and base + functions[ordinals[i]] is the function’s actual address. No Windows API involved.
Using it
1
2
3
4
5
6
7
8
9
10
11
12
13
14
15
16
// Step 1: Find ntdll via stack scan + MZ walk (same as Technique 1)
ULONG_PTR ntdllBase = /* ... found via stack scan ... */;

// Step 2: Manually parse ntdll's export table to find RtlPcToFileHeader
//         This is US walking the PE, not calling kernel32!GetProcAddress
typedef PVOID (WINAPI *fn_RtlPcToFileHeader)(PVOID, PVOID *);
ULONG_PTR fnAddr = ManualGetProcAddress(ntdllBase, "RtlPcToFileHeader");
fn_RtlPcToFileHeader pResolve = (fn_RtlPcToFileHeader)fnAddr;

// Step 3: Use it to find kernel32 from any stack code pointer
for (ULONG_PTR p = rsp; p < stackBase; p += sizeof(ULONG_PTR)) {
    ULONG_PTR val = *(ULONG_PTR *)p;
    PVOID imageBase = NULL;
    pResolve((PVOID)val, &imageBase);
    // If imageBase != ntdll, check if it's kernel32 via export name
}
RtlPcToFileHeader is a legitimate ntdll export that does exactly what FindModuleBase does, but using the loader’s internal data structures. Once you have it, finding any other module from a code pointer is a single function call.
Verify in WinDbg
You can walk the export table manually:
1
2
3
; Search ntdll for the function name string
0:000> s -a <ntdll_base> L?200000 "RtlPcToFileHeader"
; Then resolve through names → ordinals → functions arrays
Or just verify the resolved address:
1
2
0:000> u <resolved_address> L1
ntdll!RtlPcToFileHeader:
Technique 4: IAT Parsing
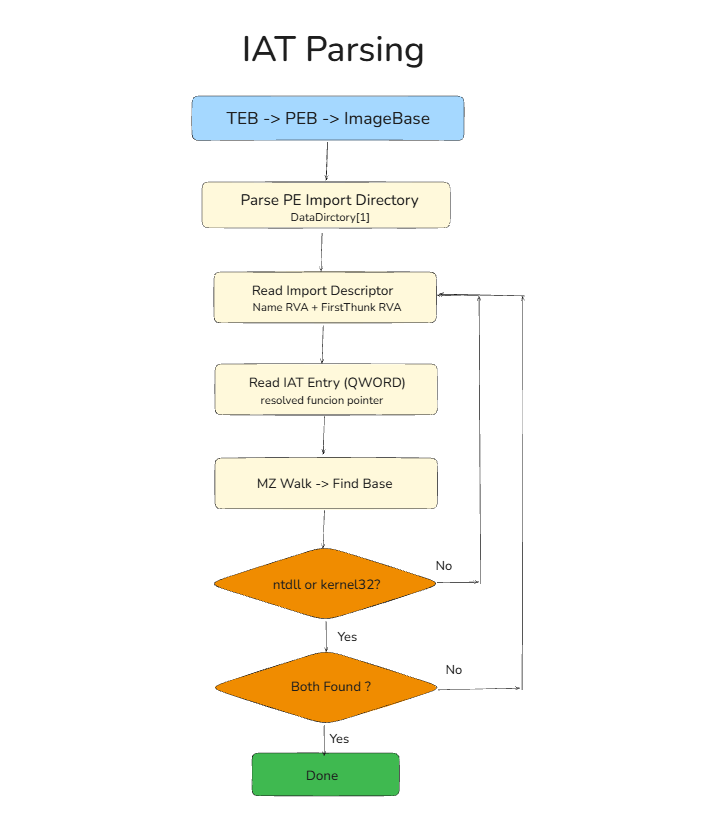
Core idea: Your executable’s PE header has an Import Directory listing every DLL it imports from, and the Import Address Table (IAT) holds resolved function pointers into those DLLs. Read the IAT, MZ-walk from those pointers.
Getting the exe’s base without Ldr
We use PEB.ImageBaseAddress - a single field at PEB+0x10. The PEB pointer comes from TEB+0x60. No linked list walking:
1
2
3
ULONG_PTR teb       = (ULONG_PTR)NtCurrentTeb();
ULONG_PTR peb       = *(ULONG_PTR *)(teb + 0x60);     // TEB+0x60 = PEB
ULONG_PTR imageBase = *(ULONG_PTR *)(peb + 0x10);      // PEB+0x10 = ImageBaseAddress
Parsing the Import Directory
The Import Directory is DataDirectory[1] in the PE Optional Header. Each entry is an IMAGE_IMPORT_DESCRIPTOR:
1
2
3
+0x00  OriginalFirstThunk  → Import Name Table (function names/hints)
+0x0C  Name                → RVA to the DLL name string ("KERNEL32.dll")
+0x10  FirstThunk          → RVA to the IAT (resolved pointers at runtime)
The IAT is key: at load time, Windows fills FirstThunk with the actual virtual addresses of the imported functions. Each QWORD in that array points into the imported DLL.
1
2
3
4
5
6
7
8
9
10
IMAGE_IMPORT_DESCRIPTOR *imp = (IMAGE_IMPORT_DESCRIPTOR *)(imageBase + importDir->VirtualAddress);

for (; imp->Name != 0; imp++) {
    const char *dllName = (const char *)(imageBase + imp->Name);
    ULONG_PTR  *iat     = (ULONG_PTR *)(imageBase + imp->FirstThunk);

    // iat[0], iat[1], ... are resolved function pointers inside that DLL
    ULONG_PTR dllBase = FindModuleBase(iat[0]);
    // Now identify it via export name...
}
The API set forwarding gotcha
Modern Windows uses “API sets” (api-ms-win-core-*) to redirect imports. Your exe says it imports from KERNEL32.dll, but the first IAT entry might actually resolve into ntdll.dll because that particular function is forwarded. The code handles this by checking multiple IAT slots, not just the first one, and also matching against the import descriptor’s name field.
Chaining: finding ntdll through kernel32
MinGW-compiled executables often don’t import ntdll directly. But kernel32 does - it imports heavily from ntdll. So the code chains: find kernel32 from the exe’s IAT, then find ntdll from kernel32’s IAT:
1
2
3
4
5
6
WalkImports(imageBase, &ntdll, &k32, "EXE");

if (!ntdll && k32) {
    // ntdll not directly imported - check kernel32's own imports
    WalkImports(k32, &ntdll, &k32, "K32");
}
Verify in WinDbg
1
2
3
4
5
6
7
8
9
10
; Get your exe's base
0:000> dq @$teb+0x60 L1       ; PEB
0:000> dq <PEB>+0x10 L1       ; ImageBaseAddress

; Dump its import descriptors
0:000> !dh <imageBase> -f

; Or read IAT entries directly
0:000> dqs <imageBase>+<FirstThunk_RVA> L10
; Shows resolved function pointers with symbols
Technique 5: VEH + Deliberate Exception
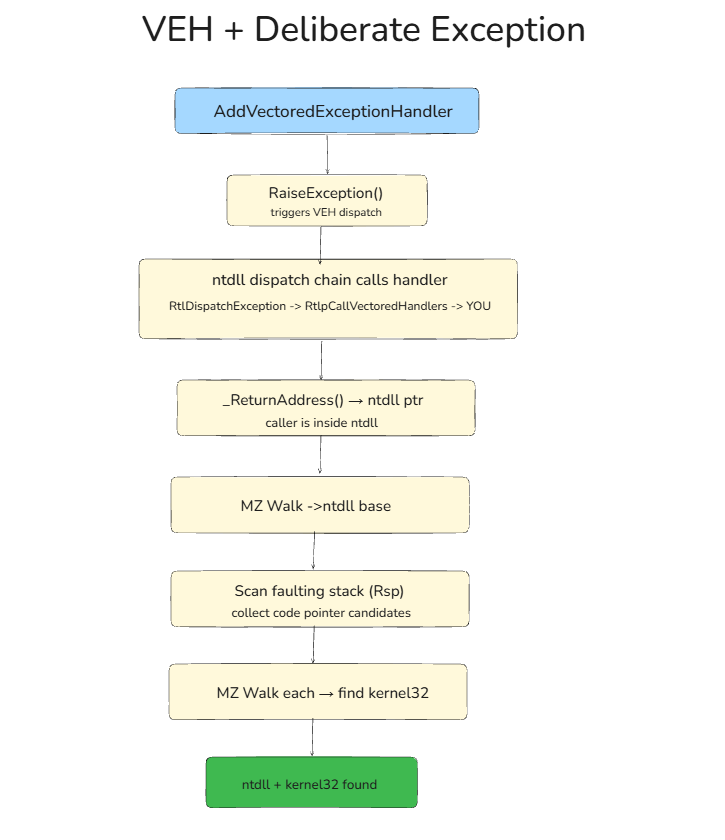
Core idea: Register a Vectored Exception Handler, then deliberately raise an exception. The VEH handler is called from ntdll!RtlpCallVectoredHandlers - so the handler’s return address points straight into ntdll. The faulting stack still has kernel32 frames from the thread entry chain.
The exception dispatch chain
When you call RaiseException(), this happens:
1
2
3
4
5
6
Your code → RaiseException()
  → KERNEL32!RaiseException
    → ntdll!RtlRaiseException
      → ntdll!RtlDispatchException
        → ntdll!RtlpCallVectoredHandlers
          → YOUR VEH HANDLER          ← return address = inside ntdll!
Inside the handler, __builtin_return_address(0) (GCC) or _ReturnAddress() (MSVC) gives you the address of the instruction in ntdll that called your handler. That’s a code pointer inside ntdll - MZ-walk from it.
The code
1
2
3
4
5
6
7
8
9
10
11
12
13
14
15
16
17
18
19
20
21
static LONG CALLBACK VehHandler(PEXCEPTION_POINTERS ep)
{
    if (ep->ExceptionRecord->ExceptionCode != TRIGGER_CODE)
        return EXCEPTION_CONTINUE_SEARCH;

    // Return address = inside ntdll's exception dispatch
    g_dispatchAddr = RET_ADDR();

    // The faulting stack has kernel32 frames - collect candidates
    ULONG_PTR faultRsp  = ep->ContextRecord->Rsp;
    ULONG_PTR teb       = (ULONG_PTR)NtCurrentTeb();
    ULONG_PTR stackBase = *(ULONG_PTR *)(teb + 0x08);

    for (ULONG_PTR p = faultRsp; p < stackBase; p += sizeof(ULONG_PTR)) {
        ULONG_PTR val = *(ULONG_PTR *)p;
        if (val > 0x10000 && val < 0x7FFFFFFFFFFF)
            g_candidates[g_candidateCount++] = val;
    }

    return EXCEPTION_CONTINUE_EXECUTION;  // resume - no crash
}
The EXCEPTION_CONTINUE_EXECUTION return is crucial - execution resumes right after RaiseException(). No crash, no SEH, works on both MSVC and MinGW.
1
2
3
4
5
6
7
8
9
10
11
12
13
int main(void)
{
    PVOID h = AddVectoredExceptionHandler(1, VehHandler);
    RaiseException(0xDEAD0001, 0, 0, NULL);
    // Execution continues here after the handler returns
    RemoveVectoredExceptionHandler(h);

    // g_dispatchAddr now points into ntdll
    ULONG_PTR ntdll = FindModuleBase(g_dispatchAddr);

    // g_candidates[] has stack values - scan for kernel32
    // ...
}
Verify in WinDbg
1
2
3
4
5
6
0:000> bp ntdll!RtlpCallVectoredHandlers
0:000> g
; When it breaks:
0:000> k
; Frame 0 will be inside ntdll's dispatch machinery
; Lower frames show kernel32!BaseThreadInitThunk
The Payoff: DJB2 Hash-Based Function Resolution
We now have kernel32.dll’s base address. The next step: resolve LoadLibraryW and GetProcAddress from it. But we don’t want function name strings like "LoadLibraryW" or "GetProcAddress" in our binary - that’s an easy signature for static analysis.
DJB2 hashing
DJB2 is a simple, fast hash function. We pre-compute the hash of the function name we want and hardcode it as a constant:
1
2
#define HASH_LoadLibraryW   0xBFAD0E5F5FBFF111ULL
#define HASH_GetProcAddress 0x996ED96FCF31BB1FULL
The hash function itself:
1
2
3
4
5
6
7
static ULONG_PTR Djb2Hash(const char *str)
{
    ULONG_PTR h = 5381;
    while (*str)
        h = ((h << 5) + h) + (unsigned char)*str++;
    return h;
}
This computes hash = hash * 33 + char for each character. It’s fast, has decent distribution, and the output is a 64-bit value (on x64) making collisions extremely unlikely.
The resolver
Walk the export table, hash each export name on the fly, compare against the target hash:
1
2
3
4
5
6
7
8
9
10
11
12
13
14
15
16
17
18
19
20
static ULONG_PTR ResolveByHash(ULONG_PTR base, ULONG_PTR hash)
{
    if (!base || !Readable(base, 0x1000)) return 0;

    IMAGE_DOS_HEADER *dos = (IMAGE_DOS_HEADER *)base;
    IMAGE_NT_HEADERS *nt  = (IMAGE_NT_HEADERS *)(base + dos->e_lfanew);
    IMAGE_DATA_DIRECTORY *dir = &nt->OptionalHeader.DataDirectory[IMAGE_DIRECTORY_ENTRY_EXPORT];
    if (!dir->VirtualAddress) return 0;

    IMAGE_EXPORT_DIRECTORY *exp = (IMAGE_EXPORT_DIRECTORY *)(base + dir->VirtualAddress);
    DWORD *names     = (DWORD *)(base + exp->AddressOfNames);
    WORD  *ordinals  = (WORD  *)(base + exp->AddressOfNameOrdinals);
    DWORD *functions = (DWORD *)(base + exp->AddressOfFunctions);

    for (DWORD i = 0; i < exp->NumberOfNames; i++) {
        if (Djb2Hash((const char *)(base + names[i])) == hash)
            return base + functions[ordinals[i]];
    }
    return 0;
}
Resolving LoadLibraryW and GetProcAddress
Both functions live in kernel32.dll, so we resolve them both from the same base:
1
2
3
4
5
6
7
8
9
ULONG_PTR pLoadLib  = ResolveByHash(k32, HASH_LoadLibraryW);
ULONG_PTR pGetProc  = ResolveByHash(k32, HASH_GetProcAddress);

// Cast to callable function pointers:
typedef HMODULE (WINAPI *fn_LoadLibraryW)(LPCWSTR);
typedef FARPROC (WINAPI *fn_GetProcAddress)(HMODULE, LPCSTR);

fn_LoadLibraryW   pLoadLibraryW   = (fn_LoadLibraryW)pLoadLib;
fn_GetProcAddress pGetProcAddress = (fn_GetProcAddress)pGetProc;
What’s in the binary
The only things in the compiled binary are the numeric constants 0xBFAD0E5F5FBFF111 and 0x996ED96FCF31BB1F. No "LoadLibraryW" or "GetProcAddress" strings anywhere. Static analysis tools looking for import names or known API strings won’t find them. The hashes are computed at compile time and hardcoded into the binary as #define constants.
How to generate hashes for other functions
Write a small utility:
1
2
3
4
5
6
7
#include <stdio.h>
typedef unsigned long long u64;
u64 djb2(const char *s) { u64 h = 5381; while (*s) h = ((h << 5) + h) + (unsigned char)*s++; return h; }
int main(int argc, char **argv) {
    for (int i = 1; i < argc; i++)
        printf("#define HASH_%-30s 0x%llXULL\n", argv[i], djb2(argv[i]));
}
Run it: hash_gen.exe LoadLibraryW GetProcAddress VirtualAlloc CreateRemoteThread
Verify in WinDbg
Once you have the resolved addresses, confirm them in WinDbg:
1
2
3
4
5
6
7
0:000> u <LoadLibraryW_addr> L1
KERNEL32!LoadLibraryW:
...

0:000> u <GetProcAddress_addr> L1
KERNEL32!GetProcAddress:
...
The addresses match. We resolved functions from kernel32’s base using only PE parsing and hash matching.
The Endgame: LoadLibraryW + GetProcAddress = Everything
This is where the whole thing pays off. Think about what we now have:
LoadLibraryW- can load any DLL by name into the processGetProcAddress- can resolve any exported function from any loaded DLL
With these two function pointers, you have the keys to the entire Windows API. Need VirtualAlloc? CreateRemoteThread? WriteProcessMemory? Anything from user32.dll, ws2_32.dll, advapi32.dll? You can get it:
1
2
3
4
5
6
7
8
9
// Load any DLL
HMODULE hUser32 = pLoadLibraryW(L"user32.dll");

// Resolve any function from it
FARPROC pMessageBoxW = pGetProcAddress(hUser32, "MessageBoxW");

// Call it
typedef int (WINAPI *fn_MessageBoxW)(HWND, LPCWSTR, LPCWSTR, UINT);
((fn_MessageBoxW)pMessageBoxW)(NULL, L"Hello", L"From Runtime Resolution", MB_OK);
Why not resolve everything by hash?
You could hardcode DJB2 hashes for every function you need and resolve them all via PE export parsing. But:
- You’d need the DLL to already be loaded (you can’t hash-resolve from a DLL that isn’t in memory)
- You’d need to find each DLL’s base separately
- You’d need a new hash constant for every function
With LoadLibraryW + GetProcAddress, you need exactly two hashes total. Everything else is a runtime string resolution through the standard API - which is perfectly normal process behavior.
Summary table
1
2
3
4
5
6
7
Technique            Source of Code Pointer         Touches PEB Ldr?
──────────────────   ─────────────────────────────  ────────────────
1. Stack Scan        Stack return addresses          No
2. Stack Bottom      Thread entry frames at bottom   No
3. Export Bootstrap  Stack → ntdll → RtlPcTo...      No
4. IAT Parsing       Resolved IAT entries            PEB.ImageBase only
5. VEH Exception     VEH handler return address      No
Every technique ends the same way: DLL base → PE export table → DJB2 hash match → LoadLibraryW + GetProcAddress → full API access. The only difference is how you get that first code pointer.
Building the code
All five techniques compile with MinGW:
1
2
3
make          # build all 5
make run      # build and run all 5
make run1     # just technique 1
Sample output (addresses will differ due to ASLR):
1
2
3
4
5
6
[*] ntdll.dll    : 0x7FFDD92C0000
[*] kernel32.dll : 0x7FFDD8480000

[*] DJB2 Function Resolution (hardcoded hashes, no strings in binary):
[*] LoadLibraryW   (hash 0xBFAD0E5F5FBFF111) : 0x7FFDD84BF6C0
[*] GetProcAddress (hash 0x996ED96FCF31BB1F) : 0x7FFDD84B3140
Both functions resolved. Both addresses verified against WinDbg symbols. No PEB→Ldr linked list was walked. No function name strings in the binary. And from here, you can resolve anything.
Key Takeaways
The PEB→Ldr linked list is not the only path. The stack, the IAT, the exception dispatch chain, and the TEB all contain enough information to bootstrap module discovery.
The 64KB alignment rule + MZ/PE validation is the universal primitive. Every technique reduces to: “get a code pointer inside a DLL, then walk backward.”
PE export tables are self-describing. You don’t need the real
GetProcAddressto parse exports - the data is right there in the mapped image. Walk the arrays yourself. That’s what ourManualGetProcAddressandResolveByHashfunctions do - pure memory reads, no API calls.DJB2 hashing removes string signatures. The binary contains
0xBFAD0E5F5FBFF111, not"LoadLibraryW". Same resolution, no string artifacts.Two function pointers unlock everything. Once you have
LoadLibraryWandGetProcAddressfrom kernel32, you can load any DLL and resolve any function. You don’t need to hash every API - just these two.These techniques compose. Technique 3 chains Technique 1 into export parsing into
RtlPcToFileHeadercalls. Technique 4 chains through kernel32’s IAT to find ntdll. The building blocks are modular.
All source code is available in the technique folders alongside this post. Compile, run, step through in WinDbg, and study how each piece fits together.